Bioinformatics-Review
Bioinformatics: an interdisciplinary field that develops and applies computer and computational technologies to study biomedical questions
The -informatics in Bioinformatics
Chapter 2 Part1- Gene and RNA
+ Gene
A gene is a locus (or region) of DNA that encodes a functional protein or RNA product, and is the molecular unit of heredity.
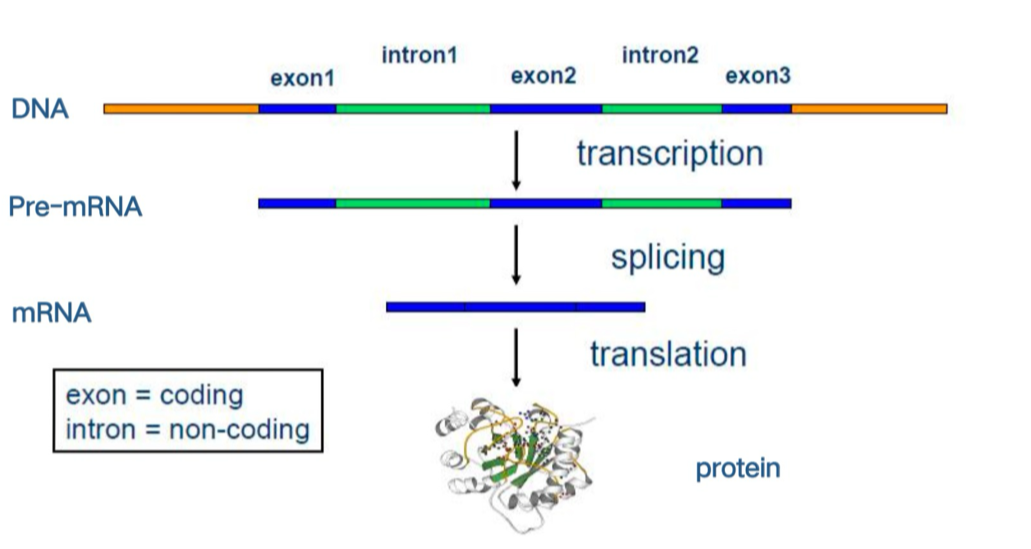
Central dogma and splicing
Gene Finding Approaches
- Something that matches statistical patterns common to all genes
- Something that matches an already known gene (homology)
- Hybrid
Gene Measurement
ORF (Open Reading Frame)
- Start codon ATG
- Stop codon TAA, TAG, TGA
Codon Usage
- The preference for certain synonymous codons, often measured by the Codon Adaptation Index (CAI), which reflects the efficiency of gene expression in an organism.
Features and motifs
- Promoters, splice sites, enhancers, untranslated regions (UTRs)
Gene Prediction
Similarity-Based Approach to gene prediction
- Genes in different organisms are similar
The similarity-based approach uses known genes in one genome to predict (unknown) genes in another genome
Problem Given a known gene and an unannotated genome sequence, find a set of substrings of the genome sequence that best fits the known gene.
Exon Chaining Algorithm
Non-coding RNA ncRNA
Transfer RNAs (tRNAs)
- the first identified RNA class.
- Function as intermediaries between DNA and amino acids in protein synthesis.
- Approximately 80 nucleotides (nt) in length.
- Have a cloverleaf-like secondary structure.
- Four short double-helical elements.
- Three loops: D loop, anticodon loop, and T loop.
microRNAs (miRNAs)
- Typically originates from non-protein-coding genomic regions or introns.
- Regulates gene expression by binding to target mRNAs, suppressing translation or promoting mRNA degradation.
- Plays a role in development and differentiation by controlling cell growth, differentiation, and apoptosis.
- Involved in disease mechanisms; miRNA dysregulation is linked to cancers, cardiovascular diseases, and neurological disorders.
Chapter 2 Part2- Genome, NGS, Transcriptome and Assembly
SNP (Single Nucleotide Polymorphism)
- Mutation of a single nucleotide (ACTG)
- Some can be associated with various phenotypic differences
- SNPs are the most common type of genetic variation among people
CNV (Copy Number Variation)
- Copy Number Variation (CNV): Refers to large segments of DNA, typically over 1 kilobase (Kb) in length, that vary in copy number compared to a reference genome.
- Types of CNVs: Includes deletions, duplications, and insertions.
- Importance of Studying CNVs:
- Can impact gene expression and adaptation.
- Provides insight into the complexity of phenotypic variation and disease mechanisms.
GWAS - Genome-Wide Association Studies
- Genome Wide Association Study (GWAS): A study of genetic variations across the genome to associate single nucleotide polymorphisms (SNPs) with traits or disease conditions.
- Purpose:
- Enhances understanding of biological processes affecting health.
- Improves disease prediction and patient care.
- Supports the advancement of personalized medicine.
Read: a short DNA fragment that is sequenced by a sequencer.
- Contents
- DNA sequence (represented by symbols).
- Quality information indicating the sequencing quality of each base.
- FASTQ format: A commonly used file format for storing sequenced DNA fragments along with their quality scores. Each record includes a sequence ID, DNA sequence, separator, and quality scores.
RNA-Seq
This flowchart follows the sequence:
- Start with the RNA sample.
- Convert RNA to cDNA using reverse transcription.
- Amplify the cDNA using PCR.
- Fragment the amplified cDNA.
- Sequence the fragments to produce reads.
Transcript Abundance
- Definition: Transcript abundance refers to the amount of mRNA molecules for a specific gene in a sample, indicating the gene's expression level.
- Importance: Higher transcript abundance reflects greater gene activity in the cell and often corresponds to genes critical for cell function.
- In RNA Sequencing: Genes with higher transcript abundance produce more reads in RNA sequencing, as they are more prevalent in the sample.
Sequencing Depth
- Definition: Sequencing depth is the total number of reads generated in a sequencing experiment, representing the coverage level of RNA in the sample.
- Importance: Higher sequencing depth increases sensitivity to detect low-abundance genes and improves accuracy in measuring gene expression.
- Normalization: When comparing gene expression across experiments, sequencing depth needs to be normalized to ensure accurate and fair comparisons of expression levels.
[!abstract]+
- Transcript Abundance affects the number of reads a gene produces; higher abundance results in more reads.
- Sequencing Depth determines the coverage and accuracy of RNA sequencing data, with higher depth allowing better detection of low-abundance genes and requiring normalization for cross-experiment comparisons.
Expression Level
RPKM (Reads Per Kilobase Million): The formula for calculating RPKM (Reads Per Kilobase of transcript, per Million mapped reads) is:
Where:
= the number of mapped reads for the specified transcript. = the total number of mapped reads in the experiment. = the length of the specified transcript in base pairs.
Genomic Data Mapping and Analysis Workflow
Reads Mapping: The colorful fragments on the left represent reads obtained from sequencing data. Through a process called mapping, these reads are aligned to the reference genome (shown as a DNA structure on the right) to determine their positions within the genome.
Mapped Alignment: Once mapped, the reads are aligned to the reference genome, forming a mapped alignment (illustrated as green bars). This step accurately locates the origin of each read within the genome.
Analysis Applications:
- Calling Genetic Variants: By comparing the sequencing data with the reference genome, genetic variants, such as single nucleotide polymorphisms (SNPs), can be identified.
- Measuring Abundance: Mapped data can be used for abundance analysis, such as RNA-Seq to measure gene expression levels, and ChIP-Seq to analyze protein-DNA interactions. These analyses help in understanding gene expression and regulatory patterns under various conditions.
Mapping Reads from RNA-Seq
- Mapping RNA-Seq Reads: RNA-Seq reads are mapped to the reference genome to locate where each read aligns.
- Junction Sites: Some reads span exon-exon junctions, indicating splice sites where introns have been removed during RNA processing.
- Detection of Novel Isoforms: By analyzing these junction reads, novel splicing isoforms can be identified, revealing alternative splicing patterns and adding insight into gene expression diversity.
Chapter 2 Part3- Alignment and NGS reads Mapping - BLAST
Chapter 3 Part1- Gene Ontology
- Molecular Function elemental activity/task
- Biological Process biological goal or objective
- Cellular Component location or complex
GO Relationships
- IS A
- PART OF
- REGULATES
- POSITIVELY REGULATES
- NEGATIVELY REGULATES
这几种格式(FASTA、FASTQ、SAM、VCF、GFF、PDB)都是生物信息学中常用的数据文件格式,各自有不同的用途和结构。以下是每种格式的总结:
1. FASTA
- 用途:存储序列数据(如DNA、RNA或蛋白质序列)。
- 结构:
- 每个序列由两行组成:第一行以
>开头,包含序列的ID或描述;第二行是实际的序列。
- 每个序列由两行组成:第一行以
- 特点:只包含序列信息,没有质量分数。适合基因组或蛋白质序列的基本存储和共享。
2. FASTQ
- 用途:存储高通量测序数据,包含序列和质量信息。
- 结构:
- 每个条目由四行组成:第一行以
@开头,表示序列标识符;第二行是序列;第三行以+开头,标记质量分数的开始;第四行是质量信息,与序列长度相同。
- 每个条目由四行组成:第一行以
- 特点:包含每个碱基的测序质量分数,常用于测序数据分析,便于质量控制。
3. SAM (Sequence Alignment/Map)
- 用途:存储序列比对信息,记录reads如何映射到参考基因组上。
- 结构:
- 文本格式,每行记录一个比对结果,包括序列名称、比对位置、匹配质量等信息。
- 特点:SAM格式文件大,但信息全面。常用于分析比对结果,可以转换成更紧凑的二进制格式(BAM)。
4. VCF (Variant Call Format)
- 用途:存储遗传变异信息,如SNPs和Indels。
- 结构:
- 文本格式,包含头信息和每个变异的记录,每行包含染色体位置、参考碱基、变异碱基、质量分数等信息。
- 特点:标准化格式,适合基因组变异数据的存储和共享,常用于基因组学和变异分析。
5. GFF (General Feature Format) / GTF (General Transfer Format)
- 用途:存储基因组注释信息,描述基因组上各种功能元件的位置,如基因、外显子、启动子等。
- 结构:
- 每行记录一个特征,包括染色体号、起始和结束位置、特征类型(如基因、外显子)、方向、附加信息等。
- 特点:标准化格式,常用于描述基因组的结构和功能注释。
6. PDB (Protein Data Bank)
- 用途:存储蛋白质三维结构信息,通常用于结构生物学。
- 结构:
- 文本格式,记录每个原子的位置、原子类型、氨基酸序列等信息。
- 特点:常用于可视化蛋白质的三维结构,适合蛋白质功能和相互作用研究。
总结表格
| 格式 | 用途 | 包含信息 | 特点 |
|---|---|---|---|
| FASTA | 序列存储 | 序列 | 结构简单,适合基本序列存储 |
| FASTQ | 高通量测序数据 | 序列 + 质量信息 | 包含质量分数,适合测序数据分析 |
| SAM | 比对信息 | 序列与参考基因组的比对位置 | 信息全面,文件较大 |
| VCF | 遗传变异信息 | 变异位点和变异信息 | 标准格式,用于变异分析 |
| GFF | 基因组注释 | 基因、外显子等功能元件位置 | 常用于基因组功能注释 |
| PDB | 蛋白质三维结构 | 原子坐标和氨基酸序列 | 用于蛋白质结构分析和可视化 |
这几种格式各有用途,分别适用于序列数据存储、测序数据质量分析、比对分析、基因组变异研究、基因组注释和蛋白质结构研究等领域。