

DV-05-Color Vision
Visual spectrum
Visible light is the small part within the electromagnetic spectrum
波长范围大约:400nm~700nm
- 紫光:~400 nm(波长短)
- 红光:~700 nm(波长长) 经典顺序:ROYGBIV
- Phong illumination model
- Ambient Light
- Diffuse Light
- Specular Light
Trichromatic theory
- Three types of cones, each sensitive to different band of wavelengths
- Long wavelength: red
- Medium wavelength: green
- Short wavelength: blue
Rods are extremely sensitive, and can be triggered by a single photon.
Cones require significantly brighter light to produce a signal.
Retinal ganglion cells
Color space
- A color space is the set of colors which can be displayed or reproduced in a medium.
- Dependent on devices and displays
- Colors of the same RGB values may look differently on different color spaces.
Color space defines the range of colors
- sRGB
- Adobe RGB
- SWOP CMYK
sRGB vs. Adobe RGB
- sRGB: display correctly on Web
- Adobe RGB: usually better for printing, but wont display correctly on web without conversion.
Color Model
A color model is the mathematical way of describing colors, independent from physical devices.
RGB
- Primary colors: Red, Green, Blue
- Additive color mixing
- Nothing = black
- Red + green = yellow
- Green + blue = cyan
- Blue + red = magenta
- Red + green + blue = white
- Usage
- Web
- TV, Computer Display
CMYK
Primary colors: Cyan, Magenta, Yellow, blacK
Subtractive color mixing
- Nothing = white
- Cyan + magenta = blue
- Magenta + yellow = red
- Yellow + cyan = green
- Cyan + magenta + yellow = black
Usage
- Color printing
RYB
- Red, Yellow, Blue are not primary colors
- Pigments absorb light
- Gamut is smaller than CMYK
HSL
More closely align with the way human vision perceives color-making attributes
- Hue:human perceived colors
- Saturation (饱和度):colorfulness, distance to gray
- Lightness (亮度):relative degree of black and white
RGB, CMYK, HSL are perceptually non-uniform
Lab
a perceptual uniform color model - Lab
Lab approximate human vision
- Luminance: human perception to lightness (black to white)
- a: green (-a) to red (+a)
- b: blue (-b) to yellow (+b)
Color map
Colormaps are used to characterize the mapping from the data domain D to color scales C in visualization.
Based on data attribute types, different colormaps shall be applied.
Categorical Colormap
There is no implied relationship between different levels of a variable
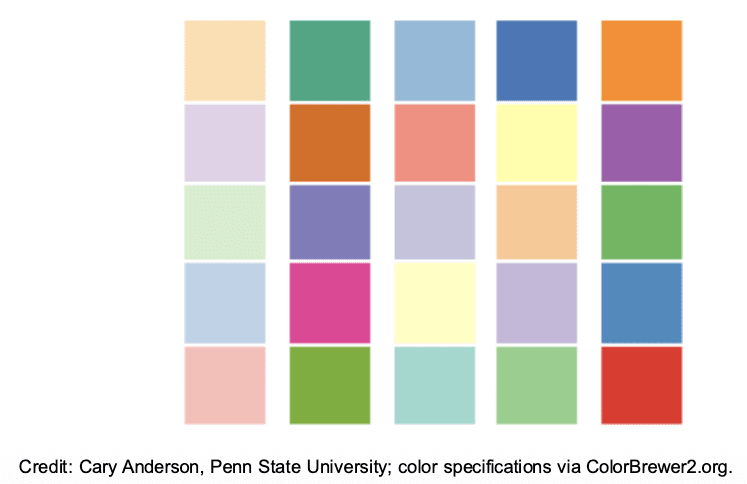
Try to order the colors
- Not able to order
- Hue is not a perceptual cue for order
Quantitative colormap
Quantitative colormaps are used for presenting quantitative data values
- Sequential colormap for sequential ordering
- Temperature, population density, rainfall
- Diverging colormap for diverging ordering
- Temperature relative to average (cooler vs. warmer)
- Above or below average (
vs. ) - Profit increase or decrease (loss vs. profit)
Sequential Colormap
Try to order the colors
- Luminance is a strong perceptual cue for order
Suitable for ordered data attributes
- Single-hue
For the Sequential plots, the lightness value increases monotonically through the colormaps.
Diverging Colormap
For the Diverging maps, we want to have monotonically increasing L values up to a maximum, which should be close to L=100, followed by monotonically decreasing L values.
- Suitable for ordered data with diverging values
Semantics of colors
Color selection shall consider semantics
Stock markets at US vs. China
Dreaded rainbow colormap
Saturation affects area perception